




















































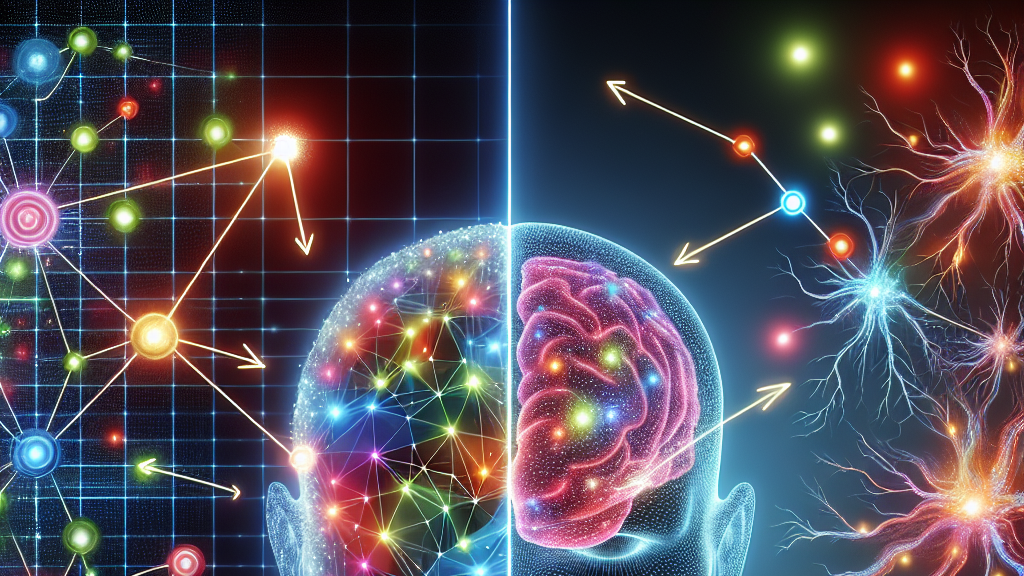











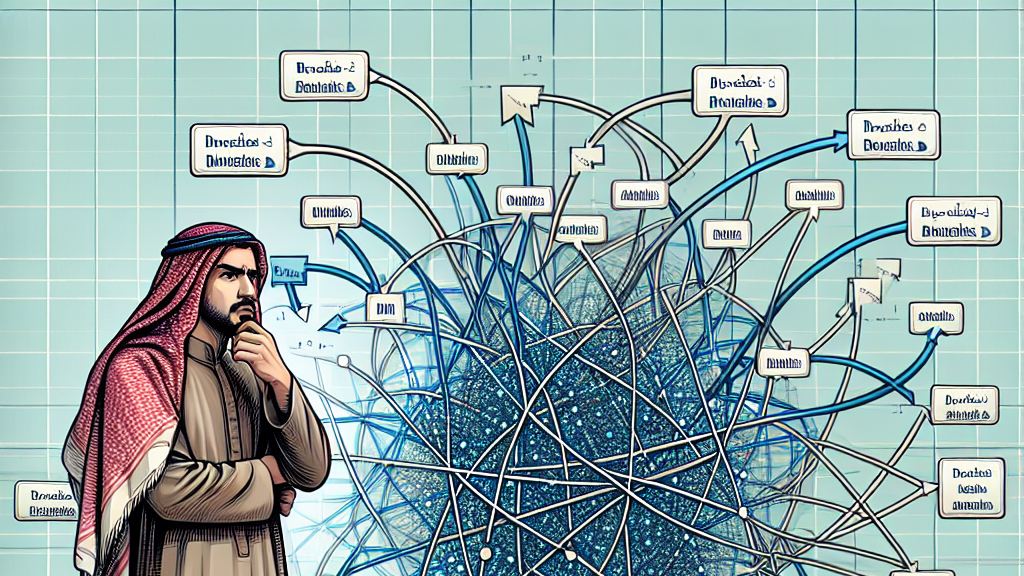
Imagine making decisions where every choice leads you to a different path, just like those adventure books you might have read as a kid. Now, picture those paths as a graph—a complex, interconnected web of options—all influencing each other in ways you might not expect. This is the world of Markovian Pandora’s Box, where researchers are finding new ways to navigate and predict outcomes more efficiently.
In recent research, scientists explored how decisions are not just isolated events but are influenced by a network of rewards and costs, all connected in a graph. This is particularly useful when dealing with big data or complex algorithms, as making the right choices can save a lot of time and resources. The study focused on creating adaptive strategies that work optimally within specific types of graphs, like forests, where the structure makes it easier to predict the best path forward.
Why does this matter to you? Well, this kind of research can lead to smarter technologies that power everything from your smartphone’s apps to the algorithms that suggest your next favorite show. By understanding how to navigate these complex graphs efficiently, we could see advancements in how quickly and effectively technology solves problems, making our digital lives smoother and more personalized.
Did you know? The way you choose what movie to watch on streaming services could soon be influenced by this kind of smart decision-making research!
FAQs
What is Markovian Pandora’s Box in decision-making?
Markovian Pandora’s Box refers to a decision-making framework where each choice is interconnected through a network of potential rewards and costs. This setup helps in predicting outcomes based on prior decisions, much like how a path is chosen in a graph.
How does this research affect technology?
This research can enhance technology by enabling more efficient algorithms that quickly determine optimal actions. This could lead to improved recommendation systems and faster data processing, ultimately making digital interactions smoother.
Why is a graph structure used in decision-making research?
Graphs provide a visual and mathematical way to map out decision pathways, showing how each choice impacts the next. This structure helps in understanding complex relationships and predicting outcomes more accurately.
What kind of practical applications can arise from this study?
Practical applications include improved algorithms for data analysis, personalized content delivery, and systems that can better adapt to user needs in real time, providing more relevant and efficient experiences.
How does Markovian correlation influence decision-making?
Markovian correlation highlights how each decision in a sequence is connected to the next, showing dependencies that can impact the overall effectiveness of a strategy. Recognizing these can lead to smarter, more adaptive decision-making processes.
Background
Markovian processes help in understanding how each decision affects future options, and they are modeled using graphs to show the interconnection between choices. These concepts are crucial in data science and algorithm design, where predicting the best outcomes from a series of options is necessary for efficiency and optimization.
History
Traditionally, decision-making under uncertainty didn’t account for interconnected choices. The introduction of Markovian dependencies in graphs allows for more detailed predictions of outcomes, a progression from simpler models where decisions were made independently without considering their impact on future options.
Based on “Markovian Pandora’s box” by Yuanyuan Yang, Ruimin Zhang, Jamie Morgenstern, Haifeng Xu, available on arXiv (arxiv.org/abs/2502.00228), used under CC BY 4.0 (creativecommons.org/licenses/by/4.0/).