































































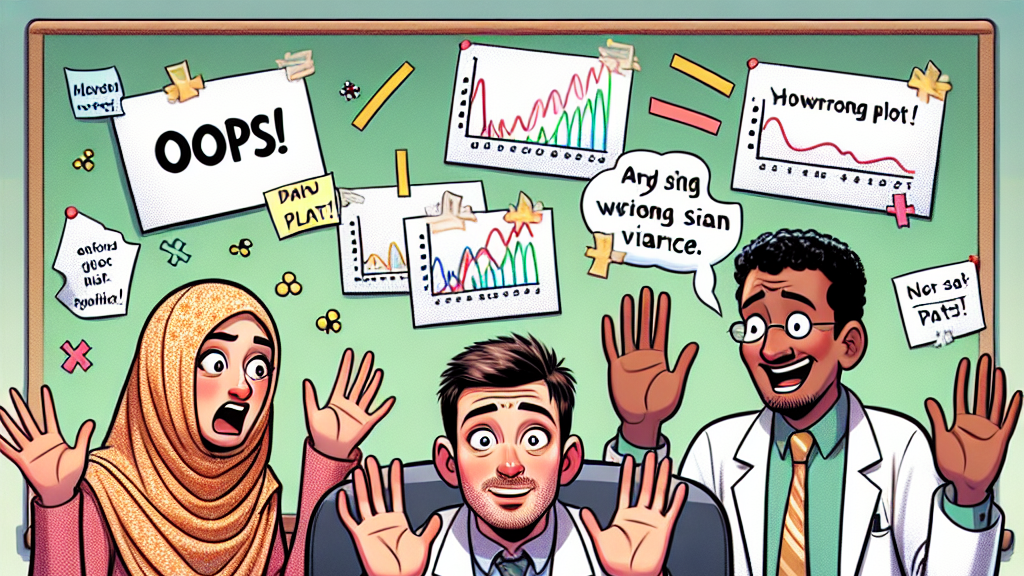
Did you know scientists might be mixing up their charts? A bunch of research papers have been calling a specific graph ‘Allan variance’ when it’s actually showing something different! While this blunder doesn’t mess up the findings, it’s like calling every dog a Labrador—it just doesn’t fit! And when you’re talking about something as crucial as exoplanet data, getting the names right is important.
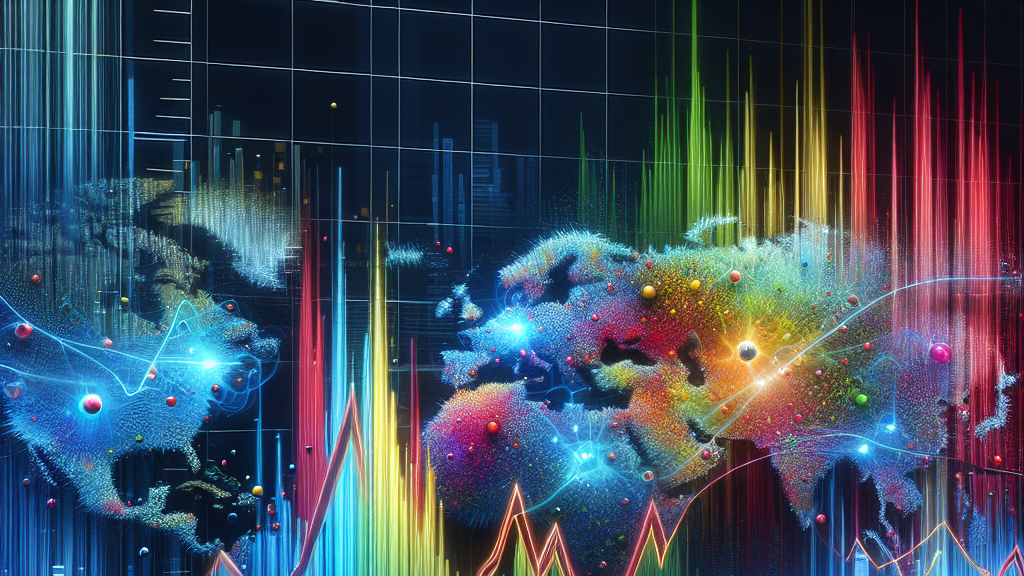
The Allan variance is a statistical measure that tells us how stable a time series is, which is super handy in fields like astronomy. But the plot these scientists are using is more like checking the leftovers in your fridge—it’s really looking at the standard deviation of residuals compared to bin size. These two might seem similar, but they tell very different stories about the data.
So what does this mean for the future? Well, if scientists make sure they’re labeling their data correctly, it could mean more precise tools for understanding planets outside our solar system! Imagine using a perfect tool to decode the secrets of distant worlds—kind of like having the exact key for a mysterious lock. It’s a small change, but it might lead to big discoveries down the line!
Surprisingly, at least 11 papers since 2024 have called the wrong plot ‘Allan variance’!
FAQs
What is Allan variance and why is it important in scientific research?
Allan variance is a statistical measure that quantifies how stable a set of time-series data is by calculating the average squared difference between successive time-averaged segments. It’s vital for accurately understanding data stability, especially in fields like astronomy.
How are scientists confusing Allan variance plots with other types of graphs?
Some scientists are mistakenly labeling plots that show the standard deviation of the residuals versus bin size as ‘Allan variance’ plots. Though they appear similar, they’re actually different measures that offer distinct insights.
Does this mix-up affect the scientific analyses in exoplanet research?
No. While the mislabeling might cause some confusion, it doesn’t impact the actual scientific analyses or conclusions of the research. It mainly highlights the need for accuracy in naming conventions.
Why is it essential to use the correct statistical measures in research?
Accurate use of statistical measures ensures that specific insights drawn from data are valid and reliable, enabling scientists to make evidence-based conclusions and advancements in their fields.
How can the scientific community prevent such mix-ups in the future?
By fostering awareness about the differences between various statistical methods, promoting education on data analysis, and ensuring peer-reviewed papers maintain rigorous standards of accuracy in their reports.
Background
The Allan variance is a statistical tool developed to assess the stability of time series data by analyzing the variation between successive averages. It’s crucial in fields like metrology and astronomy, where understanding the long-term behavior of data is important. However, it seems that some researchers are confusing this with another plot that deals with standard deviation, leading to mix-ups in naming.
History
The Allan variance was named after David W. Allan and has been a standard tool in time series analysis since its development. Its application ranges from clock stability in timekeeping to planetary studies. Over the years, it has become essential for ensuring that interpretations of time series data are precise and reliable. Recent mix-ups in its application highlight the need for clarity in scientific communication.
Based on “Exoplaneteers Keep Calling Plots ‘Allan Variance’ Plots When They Aren’t” by David Kipping, available on arXiv (arxiv.org/abs/2504.13238), used under CC BY 4.0 (creativecommons.org/licenses/by/4.0/).
