



































































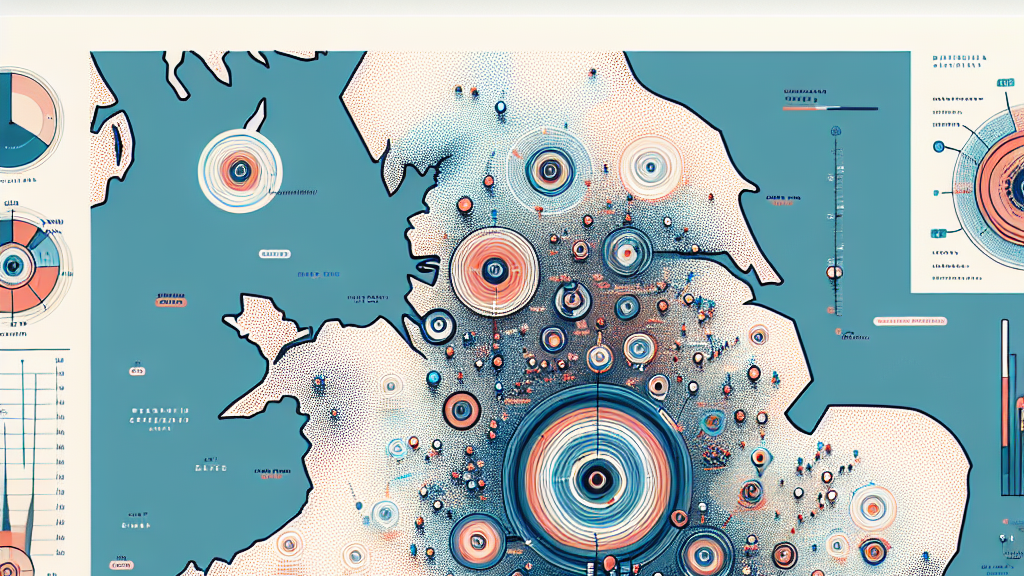
How do we really know where a city begins and ends, or why it’s prosperous in one area and struggling in another? A new method uses something called the Valeriepieris circle to dig deep into the heart of cities, mapping out the often hidden stories told by their people and economy. It’s like drawing a series of ever-expanding circles around data points to unveil the layers that make up a city’s social fabric.
This method is novel because it takes complex data like population, jobs, and transport, and simplifies it into circles that can be easily analyzed. By doing so, researchers can determine natural boundaries and gain insights into the way cities grow and interact. For instance, when applying this method to England and Wales, it highlights well-known facts like London’s wealth and the sense of seclusion in the North East.
Imagine city planners using these rings to better understand urban development or policymakers pinpointing areas needing economic boost. This method could revolutionize how we perceive and plan for the growth and sustainability of our cities. The next time you walk through your city, consider if these invisible circles might explain why one street thrives more than another.
The Valeriepieris circle originally highlighted how a large portion of Earth’s population lives within a surprisingly small geographical area.
FAQs
What is the Valeriepieris circle, and how does it apply to city boundaries?
The Valeriepieris circle originated as a concept showing a small area containing a significant portion of the global population. In this study, it’s used to form concentric rings around data points in cities, helping to define natural boundaries and insights.
How does mapping data with concentric circles reveal new insights about cities?
By mapping data like population and economic information into simple concentric circles, researchers can identify natural boundaries and patterns. This method unveils how cities develop and interact, offering a fresh perspective on their inner workings.
Why is understanding natural boundaries in cities important?
Understanding natural boundaries helps determine how cities function and grow. Policymakers and planners can use these insights to make informed decisions about urban development, economic support, and resource distribution.
What surprising insights were found about England and Wales using this method?
Interestingly, the method affirmed well-known social facts such as London’s disproportionate wealth and the isolation of regions like the North East and South West of England, providing a visual representation of these dynamics.
How can this mapping method improve urban planning and policy-making?
By offering a clearer understanding of city dynamics, planners can strategically target areas for development or conservation. It aids in decisions like where to allocate resources or how to tackle urban issues effectively.
Background
The Valeriepieris circle concept originally showed that a surprisingly large percentage of the world’s population lives within a relatively small geographic area. In this research, scientists adapted that idea to city boundaries, using circles to simplify and analyze complex data. The goal is to identify where cities naturally begin and end based on various factors like population density and economic activity.
History
The Valeriepieris circle was a popular internet sensation that visually represented population density in Asia. It sparked interest in using circular models to interpret data in new ways. This study builds on that idea, applying it to urban data mapping to uncover patterns in city boundaries and social dynamics.
Based on “Valeriepieris Circles Reveal City and Regional Boundaries in England and Wales” by Rudy Arthur, Federico Botta, available on arXiv (arxiv.org/abs/2502.07451), used under CC BY 4.0 (creativecommons.org/licenses/by/4.0/).
