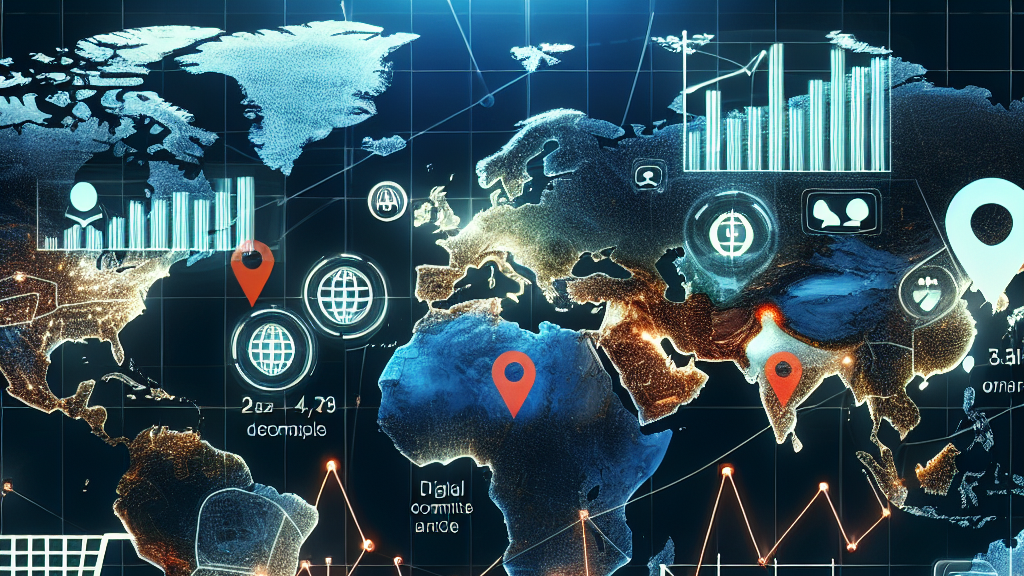


































































Imagine a roller coaster ride—one moment you’re climbing, the next you’re plunging down with your heart racing. That’s what happened with the US stock and commodity markets during the COVID-19 crash. This study uses a fascinating method called Topological Data Analysis to identify these heart-stopping market plunges across different sectors. It reveals spikes in market interdependence that tell a tale of how interconnected our financial world really is during a crisis.
At the heart of this research is the idea that different markets and sectors don’t just crash in isolation—they often mirror each other under stress, which we saw vividly during COVID-19. By applying advanced maths and data techniques, researchers found that stock and commodity markets were noticeably synchronized. They used something called the Wasserstein Distance to highlight how the markets moved in tandem and pinpointed where one market might have lagged behind the other, creating the perfect storm of financial jitters.
This kind of analysis isn’t just for academics—it’s vital for everyday investors too. Understanding how these markets relate during a crisis can help you make smarter investment choices. For example, if another global event hints at a sharp drop in stocks, knowing that commodities might follow could help you hedge your bets wisely. This research paves the way for more resilient financial planning and could be the key to protecting your assets during future economic downturns.
Did you know? During the COVID-19 crash, the US stock and commodity markets mirrored each other’s ups and downs, showing just how connected our economy can be.
FAQs
What makes the COVID-19 crash different for the US stock and commodity markets?
The COVID-19 crash led to heightened interdependence between the US stock and commodity markets. This study found that significant changes occurred in their relationships, with both markets impacting each other more during the crisis.
How can Topological Data Analysis help understand market crashes?
Topological Data Analysis offers a novel way to identify patterns and relationships in market problems that traditional methods might miss. During the COVID-19 crash, it helped capture the synchronization and differences between the stock and commodity markets and within various sectors.
What is Granger-causality and why is it important in this study?
Granger-causality is a statistical method used to determine if one time series can predict another. In this study, it showed a bidirectional causality between US stock and commodity markets during the crash, indicating strong interdependence.
Why should investors care about these findings?
Investors can use insights from this study to anticipate market movements during future crises, allowing for better risk management and more informed decision-making regarding their portfolios.
Can this analysis predict future market crashes?
While it can’t predict specific crashes, this analysis can help investors understand the dynamics and interdependence of markets under stress, providing a valuable tool for navigating potential economic turmoil.
Background
Topological Data Analysis is an advanced mathematical method used to study the shapes and structures within data, ideal for identifying patterns in complex datasets like financial markets. The Wasserstein Distance is a measure that helps identify differences or lags between datasets, such as how markets respond differently to events. Granger-causality is a statistical concept used to analyze whether one time series can forecast another, crucial in understanding how different markets influence one another.
History
The study of market crashes and interdependence isn’t new, but combining Topological Data Analysis and Granger-causality provides unique insights. Previously, economists relied heavily on linear models, but these might miss the complexity of market relationships. By using these innovative methods, researchers are opening new pathways for understanding financial ecosystems, especially during unprecedented events like the COVID-19 pandemic.
Based on “Causality Analysis of COVID-19 Induced Crashes in Stock and Commodity Markets: A Topological Perspective” by Buddha Nath Sharma (National Institute of Technology Sikkim, India), Anish Rai (National Institute of Technology Sikkim, India), SR Luwang (National Institute of Technology Sikkim, India), Md. Nurujjaman (National Institute of Technology Sikkim, India), Sushovan Majhi (Data Science Program, George Washington University, Washington, DC, USA), available on arXiv (arxiv.org/abs/2502.14431), used under CC BY 4.0 (creativecommons.org/licenses/by/4.0/).